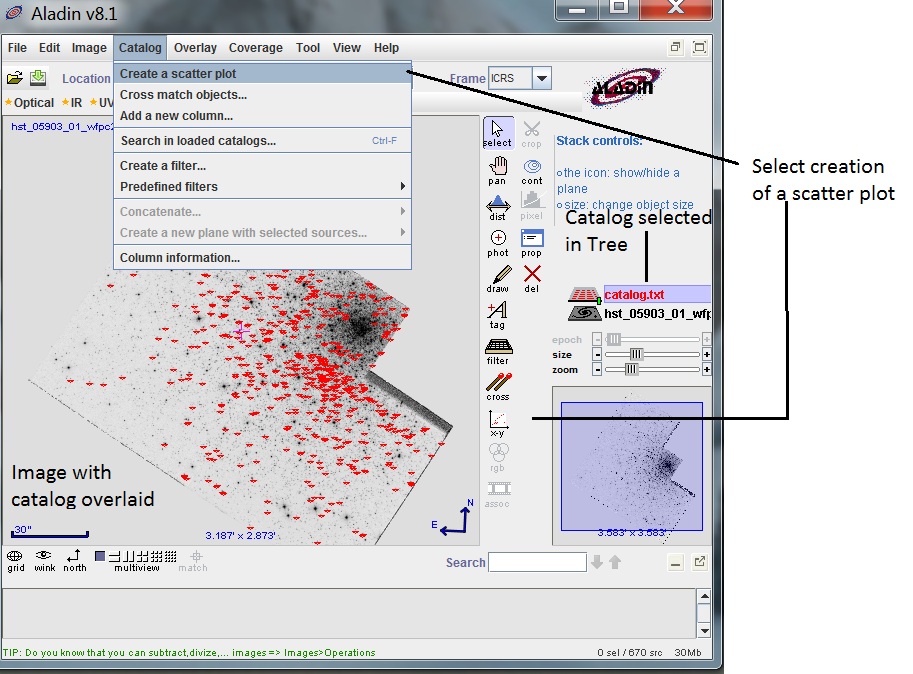
You first need to read in your image and source catalog. With the
catalog selected in the Aladin Tree, go under Catalog and select
"Create a Scatter Plot".
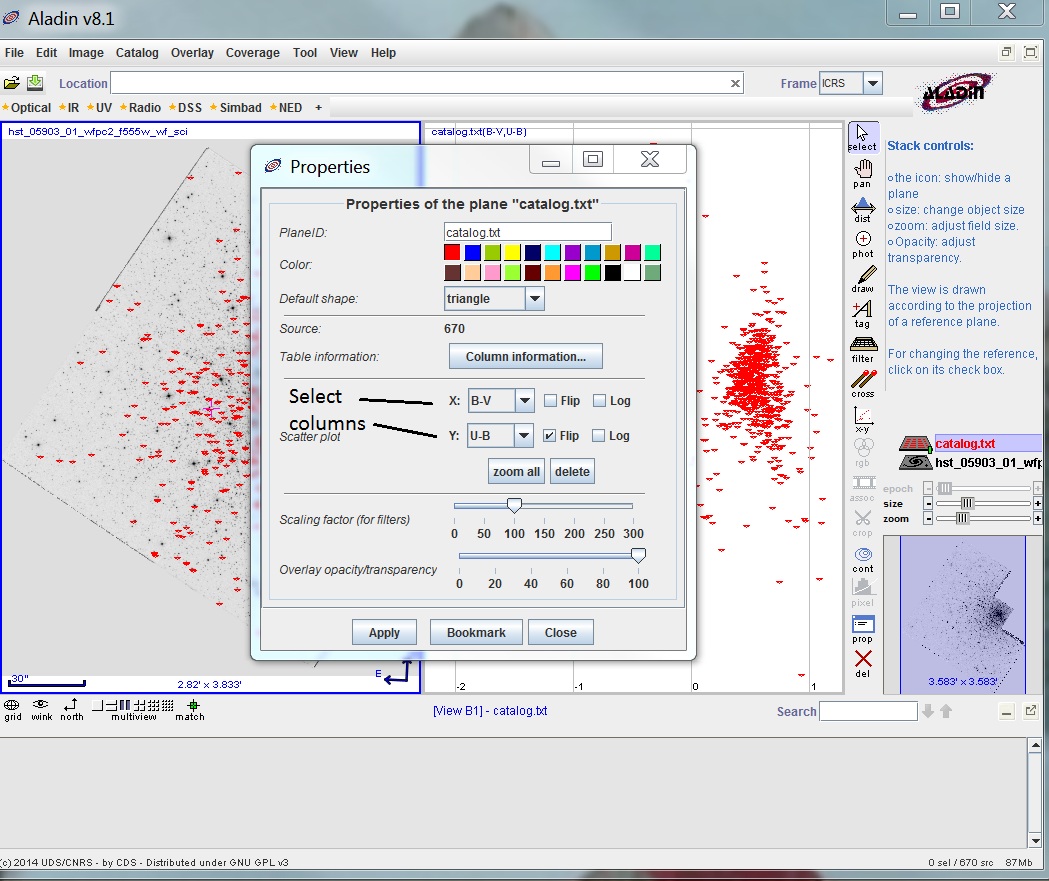
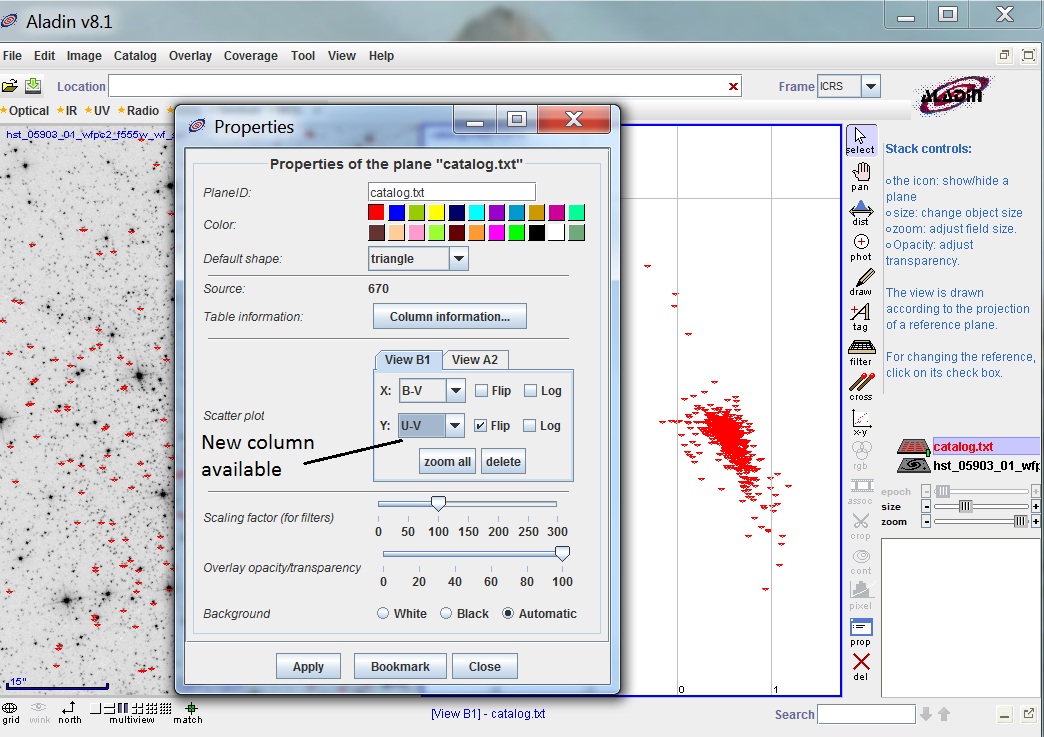
Select the appropriate columns for the plot. Note that you
can flip the axis (i.e. go from Minimum to Maximum instead of
Maximum to Minimum) if necessary.
If you click on a star in the plot (or image), it will be highlighted
in the image (or plot). You can also selected a group
of stars in the plot, and these will be highlighted in the
image.
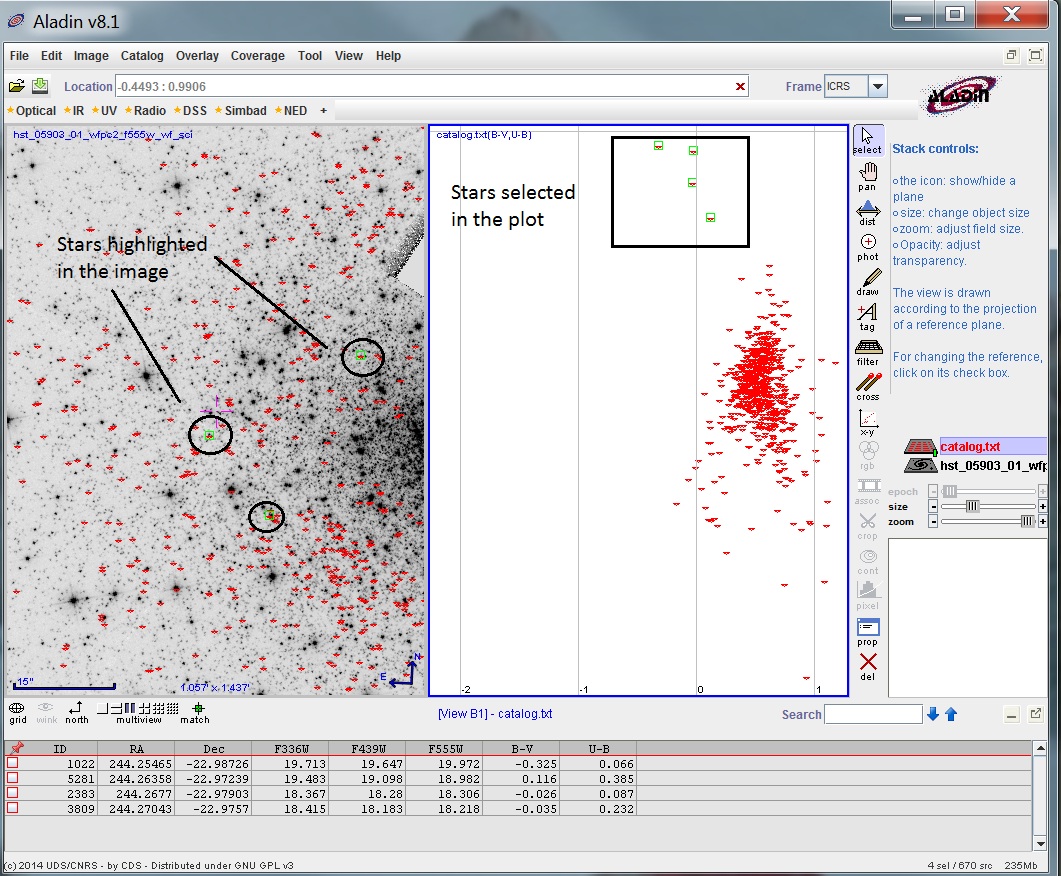
If you select the catalog in the Aladin Tree, you can change the scaling of the plot by using the Zoom function (just like with images).
You can also add new columns to your catalog (based on data
in the catalog). Under Catalog, select "Add a New Column".
Enter the name of the column, and create the new field.
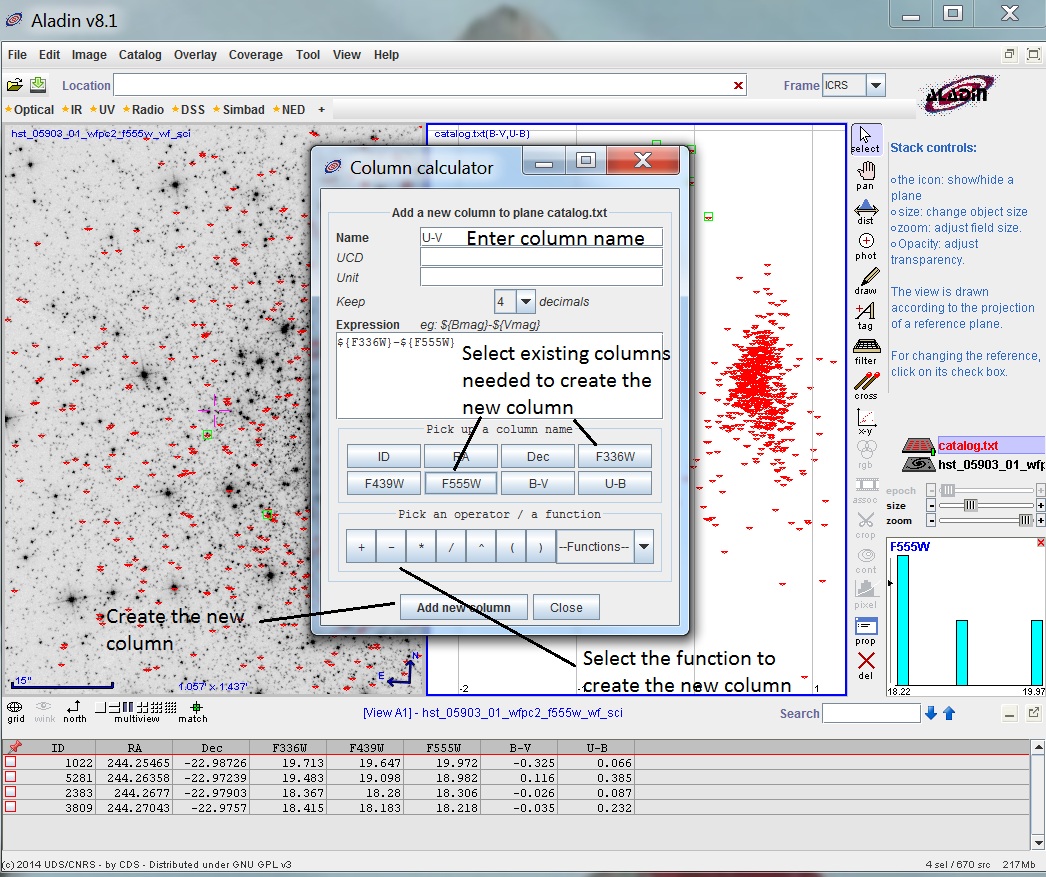
You can now use this column to make a new plot.
This is the initial release of this capability, and there are some limitations in its use
We welcome any suggestions for improvements or enhancements, which we will pass them on to the Aladin team for consideration.