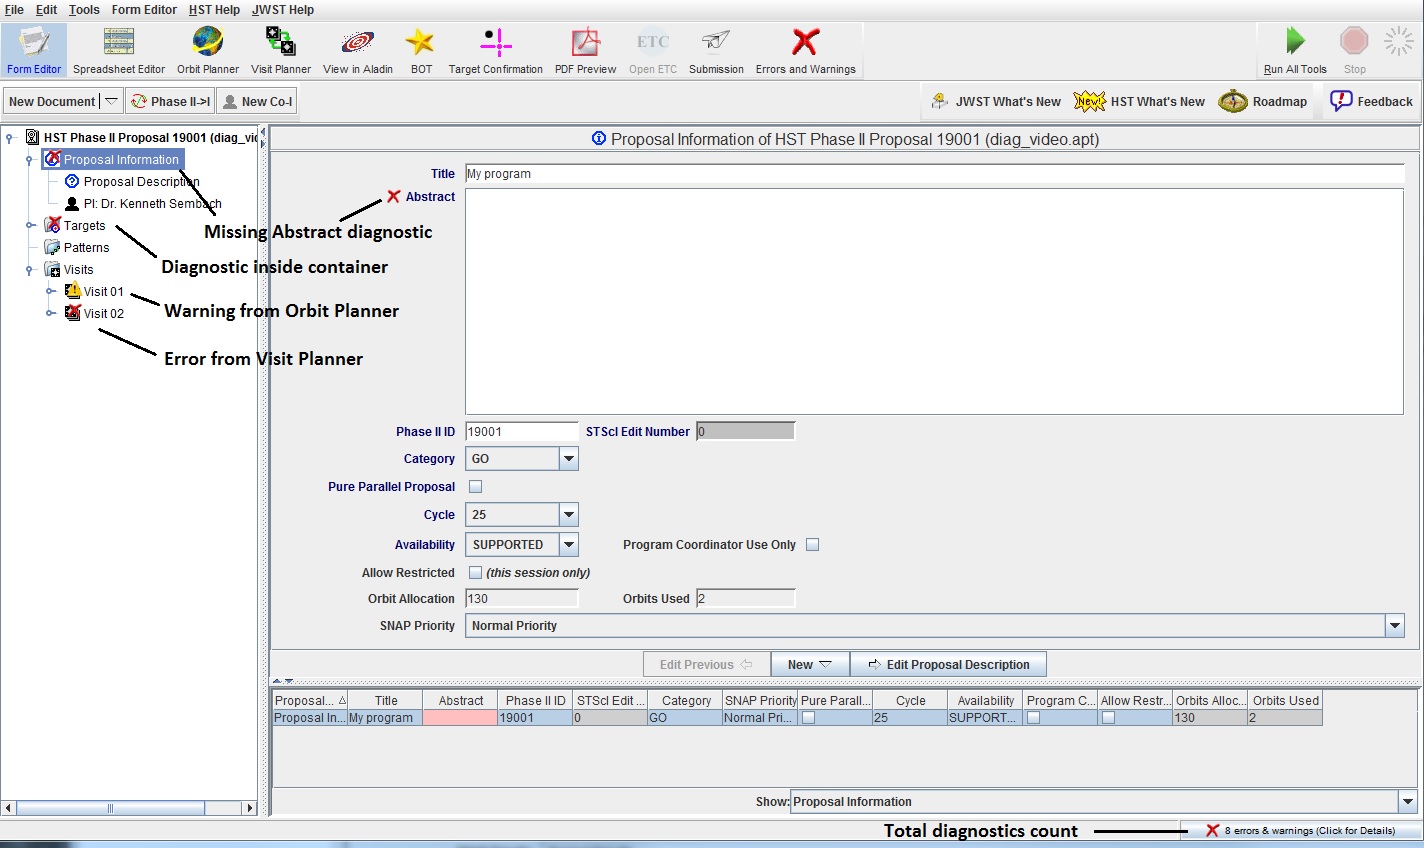
Errors and Warnings Report tool in the tool-bar
 )
or warnings (
)
or warnings ( )
which indicate that there is a problem with the proposal.
All diagnostics should be resolved prior to submission. If a given
diagnostic cannot be resolved (e.g. it is not clear what to do),
please contact your Program Coordinator (HST Phase II),
hsthelp.stsci.edu
(HST Phase I), or
jwsthelp.stsci.edu
(JWST).
For a demonstration using specific examples, see the
training
movie.
Errors and Warnings Report tool in the tool-bar
or
the
to display a tool-tip with a short summary of the problem.
or
to display a tool-tip
with a short summary of the diagnostic. Note that the Tree Editor
displays containers, so it may be necessary to open a container to get
the tool-tip on the diagnostic. Besides syntax errors, problems encounter
while running the Orbit and Visit Planners are also indicated; these
appear in the Tree editor on the Visit.
)
which indicate that there is a problem with the proposal.
All diagnostics should be resolved prior to submission. If a given
diagnostic cannot be resolved (e.g. it is not clear what to do),
please contact your Program Coordinator (HST Phase II),
hsthelp.stsci.edu
(HST Phase I), or
jwsthelp.stsci.edu
(JWST).
For a demonstration using specific examples, see the
training
movie.
Errors and Warnings Report tool in the tool-bar
or
the
to display a tool-tip with a short summary of the problem.
or
to display a tool-tip
with a short summary of the diagnostic. Note that the Tree Editor
displays containers, so it may be necessary to open a container to get
the tool-tip on the diagnostic. Besides syntax errors, problems encounter
while running the Orbit and Visit Planners are also indicated; these
appear in the Tree editor on the Visit.
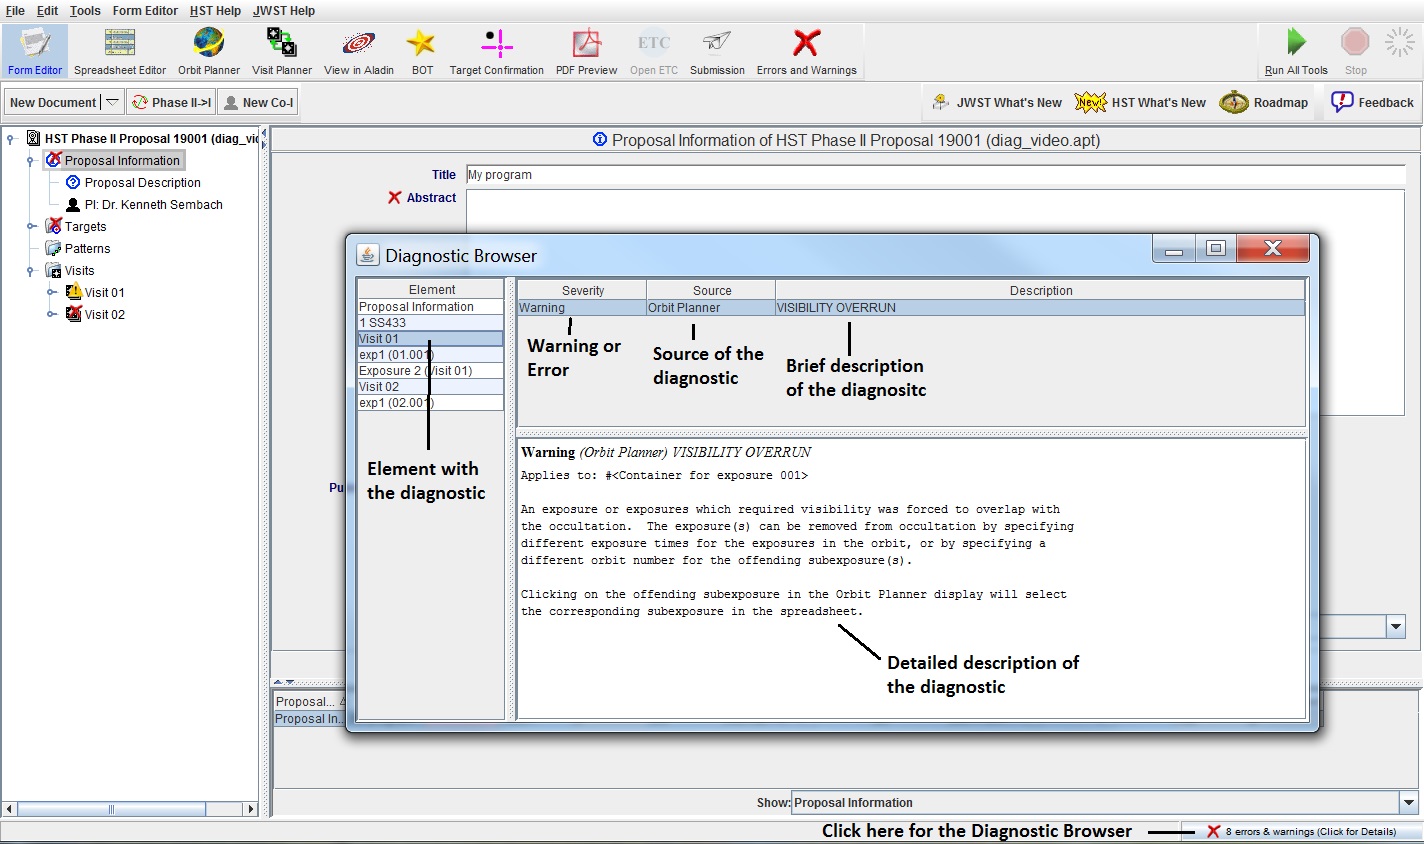
To obtain information on a diagnostic, click on the element in the Element column. This will result in the remaining fields being populated. Note that if there are multiple diagnostics in a given Element, selecting that Element shows the complete set of diagnostics.
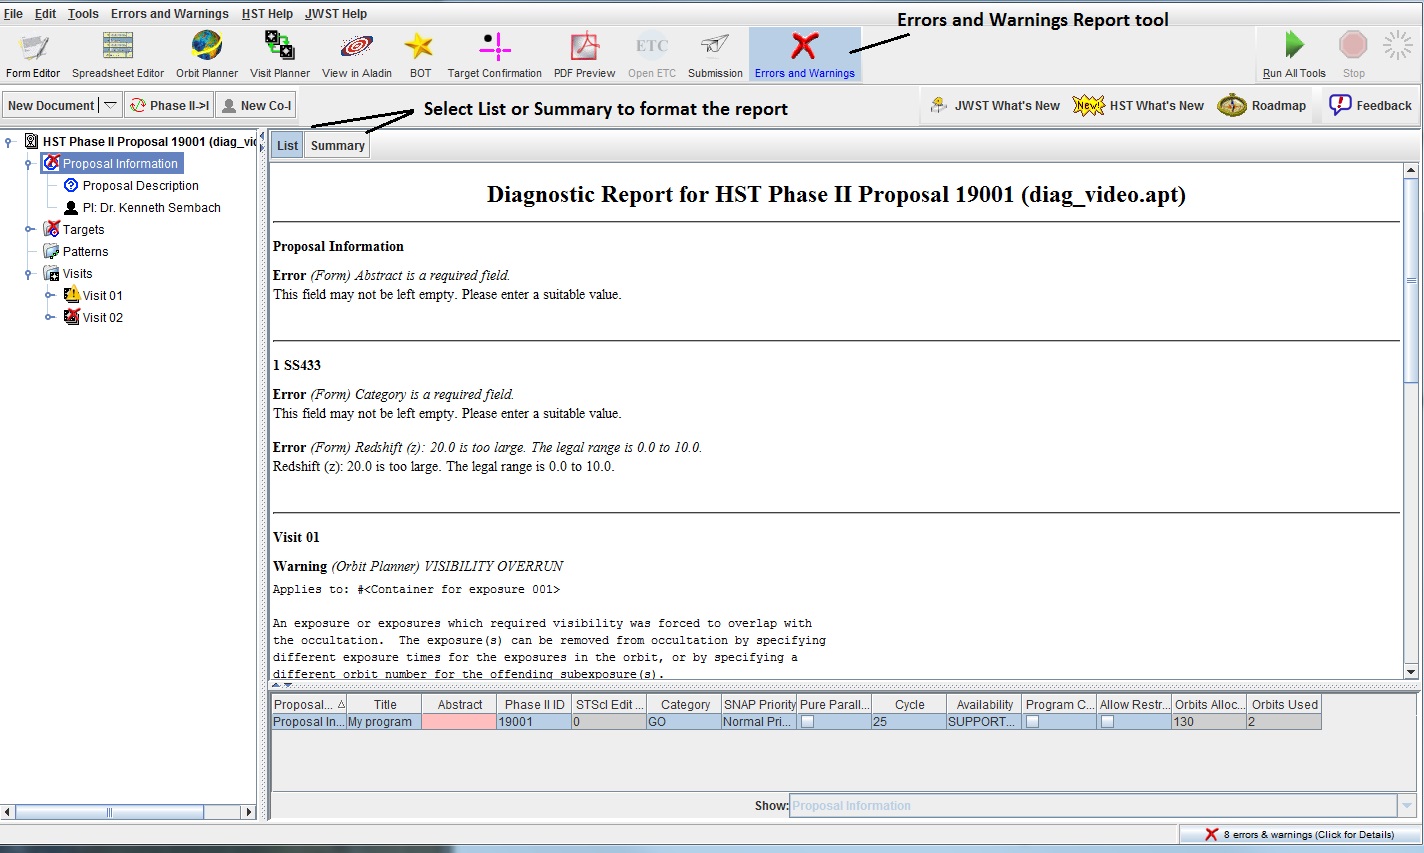
Errors and Warnings
Report tool in the main tool-bar. If List is selected, the items
appear sorted by
object (e.g. all the target SS433 errors together). If Summary is
selected, the items will be sorted type of
diagnostics (e.g. all the Visibility Overruns together).
Note that items in this tool can
be copied (highlight the text and use the ctrl-key appropriate to your
operating system) and pasted into
another buffer to facilitate sending the diagnostic to your Program
Coordinator. Alternatively if you would like a hard copy you can
select "Print" from the "File" menu while you are in this tool.