CONFIRMATION CHARTS FOR FIXED TARGETS
Creating the charts
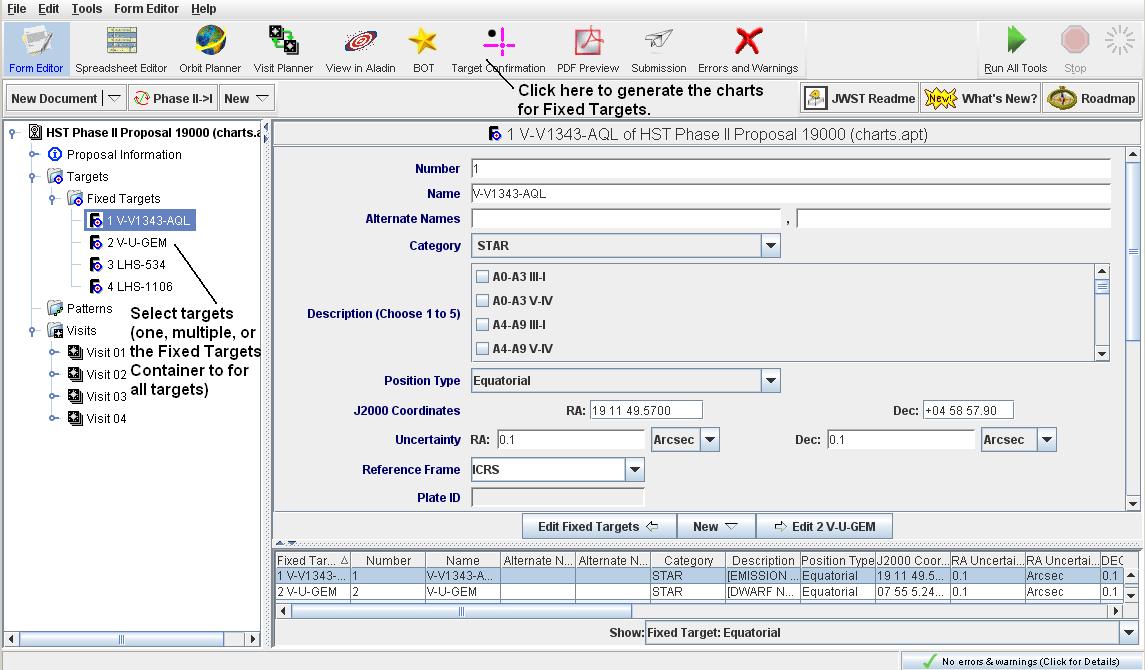
To generate confirmation charts for fixed targets (click
here
to see movie),
you must select
the target(s) of interest in the Tree Editor. You may select
one target or multiple targets. If you select the Fixed Targets
Container, charts will be made for all targets. Note that if
no target is selected (e.g. you have selected an Observation
or Visit), charts will be made for all fixed targets.
Click on the  button to
generate the charts. If you have already saved your proposal,
the chart files will be placed in the proposal directory. If
you have not yet saved the proposal, APT will ask you to save the
proposal prior to making the charts.
Once the charts are made, you will get a popup showing the
directory when the charts are stored. The
charts are named Prop ID_number, when number is the target number in
the proposal; since there is no proposal ID in Phase I, the files
are called null_number.
You also have the option of opening PDF viewers for the charts. Note
that you will get a separate viewer for each chart, so if you made a
large number of charts, you probably should not use this option

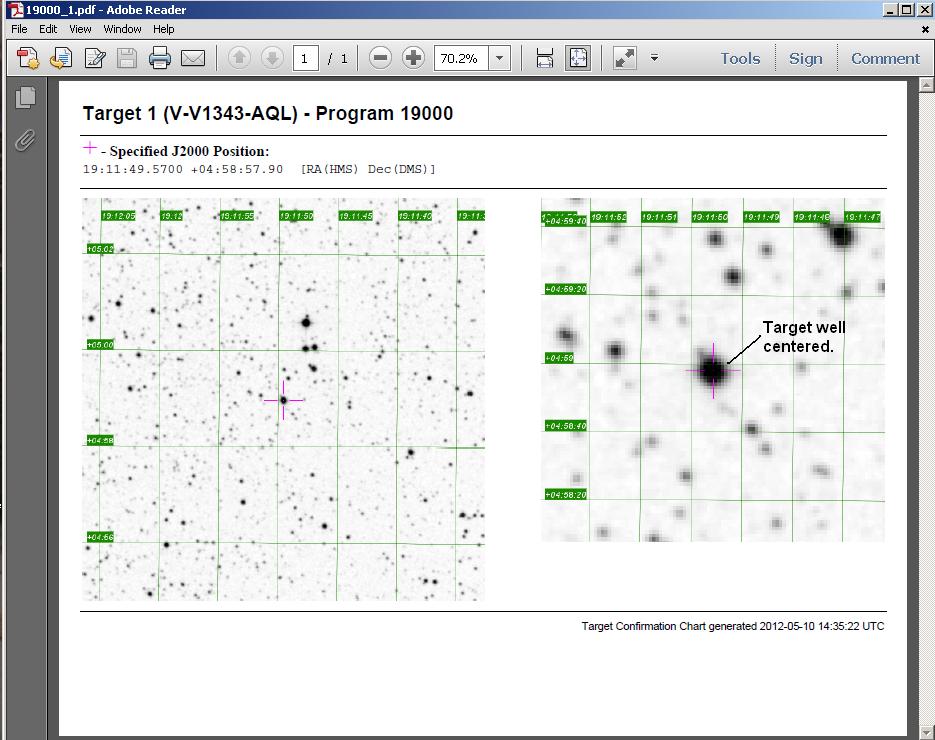
Example 1: Chart helps you confirm that the coordinates are good
In this example, V1343-Aql, you can see that the crosshairs are
located directly on the target, showing that the correct coordinates
have been entered in the proposal
Example 2: Chart helps you detect that coordinates are bad
In this example, U Gem, the crosshairs are NOT on the target, so the
coordinates are in error.
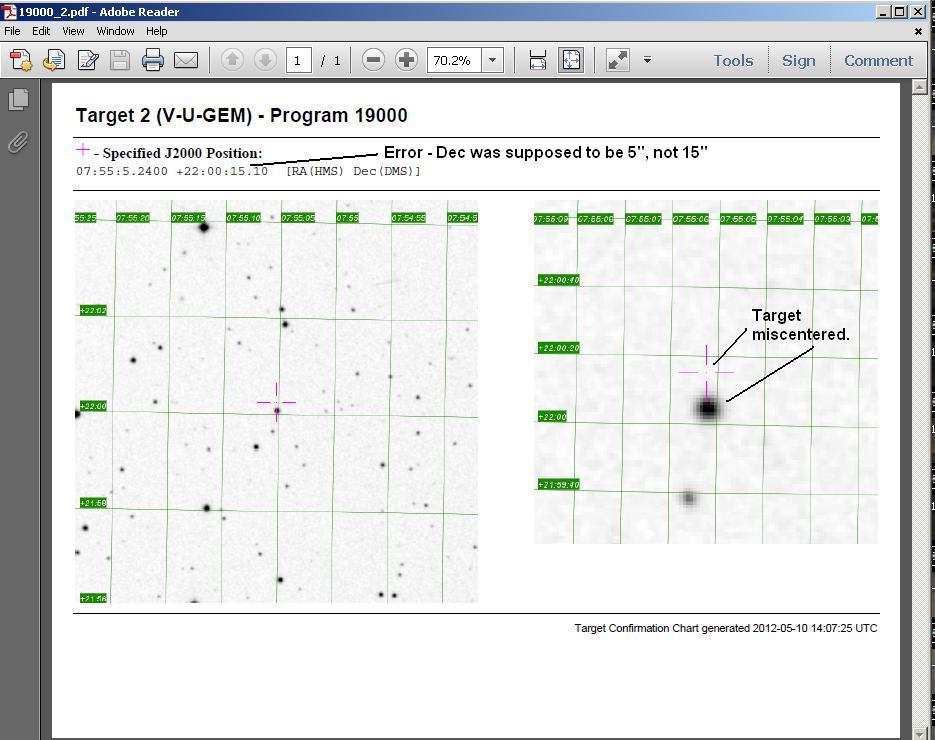
In looking at the coordinates, we see that the declination was mistyped
(it was supposed to be 5" but is instead 15").
If we correct this error, the crosshairs will overlay on the target,
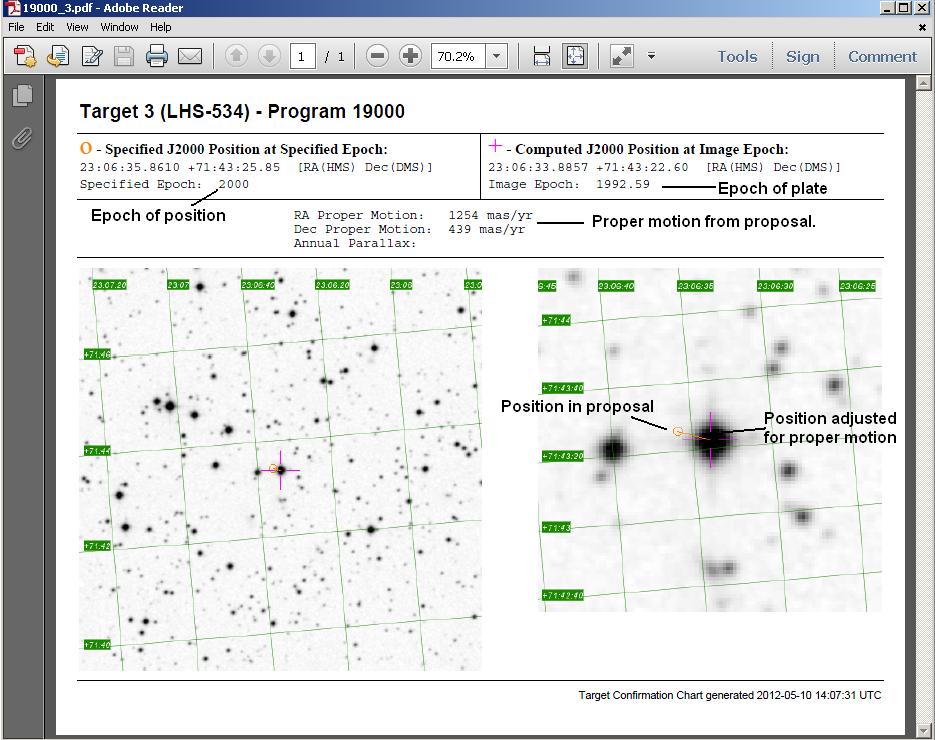
Example 3: How to understand a chart with proper motion
In this example, LHS 534, the object has a significant proper
motion, which we included in the proposal. In the chart, the circle
indicates the position we gave for the target. The crosshair
location has been adjusted by the proper motion appropriate for
the epoch of the underlying DSS image. In this case, the epoch of
the coordinates was 2000, while the DSS image has an epoch of 1992.59,
so ~8 years of proper motion has been applied. As you can see, if
we did not include the proper motion, this target would NOT have
been centered in the science aperture
Example 4: How to detect that the proper motion is incorrectly specified
In this example, LHS 1106, the object has a significant proper motion.
However, in the chart, the crosshair is NOT on the target, so something
is wrong.
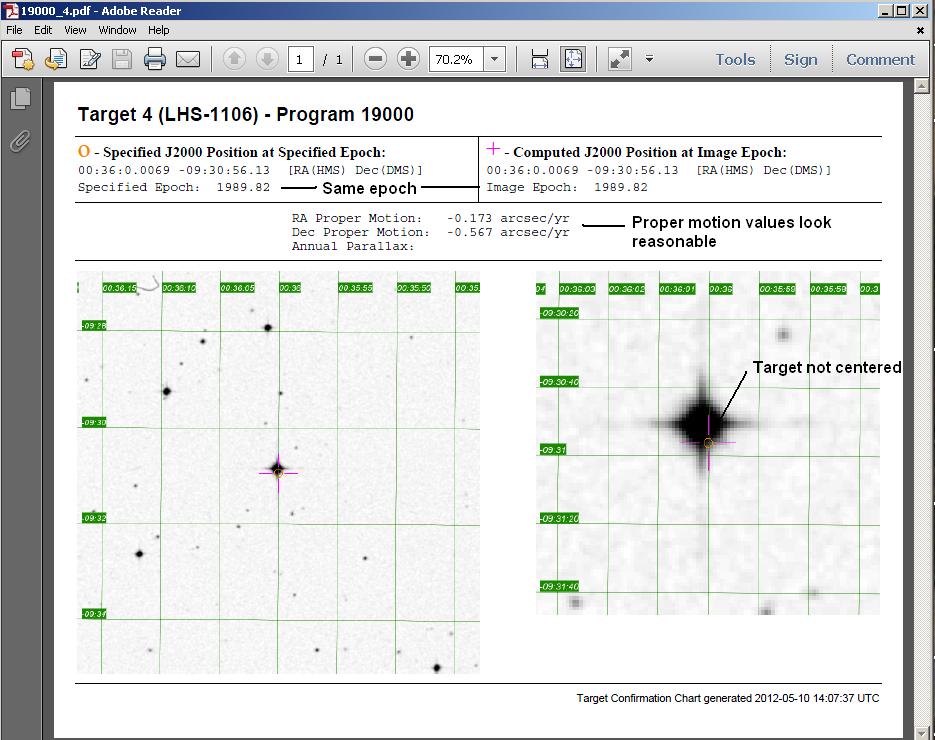
We note that the circle and the crosshair are at the same
location, so the proper motion is essentially zero. There are two
possibilities:
we incorrectly enter the proper motion values (for
example, selected mas/yr instead of arcsec/yr which would result in a
very small offset), or
we entered the epoch of the underlying image instead of the epoch
of the image from which the coordinates were derived.
If we look at
the header, we see that the pm values are reasonable, but that the
specified epoch is equal to the image epoch. We thus need to change
the epoch in the proposal to be the epoch of the coordinates and not
the underlying image.
For more information on confirmation charts, please see the
FAQ.
Last modified: May 10, 2012.
 button to
generate the charts. If you have already saved your proposal,
the chart files will be placed in the proposal directory. If
you have not yet saved the proposal, APT will ask you to save the
proposal prior to making the charts.


